

GroundControl
GroundControl is our edge application that helps you with the local setup on each machine. From providing you access to the UniteLabs registry and with that our connector library, installing and configuring connectors, to communication with the connectors and the platform. It has three main areas: Home (auto-detected connectors and 3rd party SiLA servers on your local network), the Devices list (your configured instruments), and Settings.
In its current state, GroundControl is not fully integrated into the UniteLabs Platform yet. Future iterations will enable full remote control of GroundControl via the platform to enable deployment and management of all edge applications with IaC.
This guide covers working with a configured connector: reading values, triggering actions, and following what happened. To add and configure a connector first, see Connector Configuration.
Interact with a Connector
Open Devices → your device → Operations tab to directly read values and trigger actions on your instrument. If a connector does not show up in the platform yet, check here if you can control the instrument. In that case, the configurations cloud endpoint may need to be adjusted.
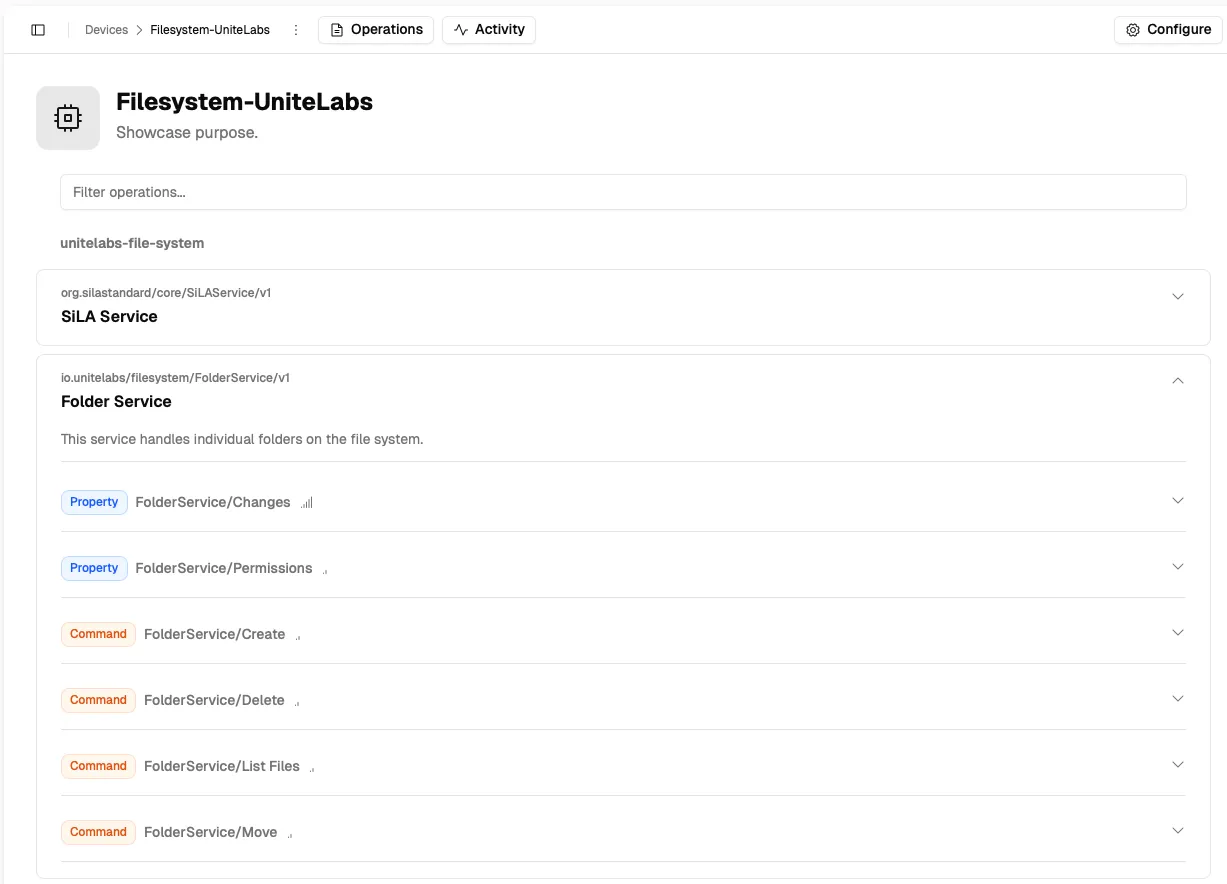
Modules and Operations
The Operations tab lists the connector's modules, for example a SiLA Service module and the instrument specific modules. Expand a module to see its operations. Each operation is one of two types:
- Property: a value you can read. Observable properties update live while you watch them.
- Command: an operation you can execute, some with a parameter form.
Long-running commands report their execution status while they run and can stream intermediate results, useful for operations like a centrifuge spin or a PCR cycle. See Action for the full model.
Activity Tab
Devices → your device → Activity shows a timestamped log of every operation executed on the device: which action was called, the parameters sent, and the result returned. The default logging behavior also stores this activity log to file; see the log file locations.
Use this to confirm that actions triggered from a workflow actually reached the instrument, or to debug unexpected behavior.
Next steps
Use a connector from the platform shows the same device in the web interface; Python reaches it from code.